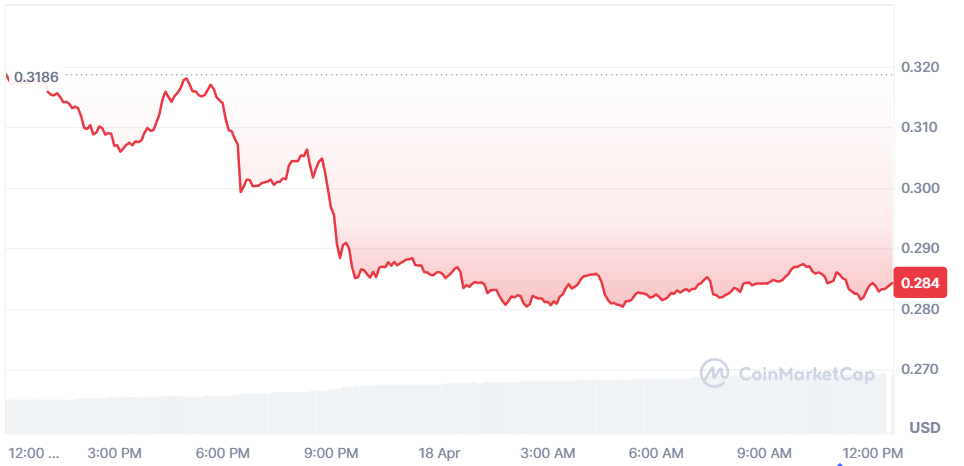
- В пятницу курс Worldcoin упал на 10,6% до $0,28.
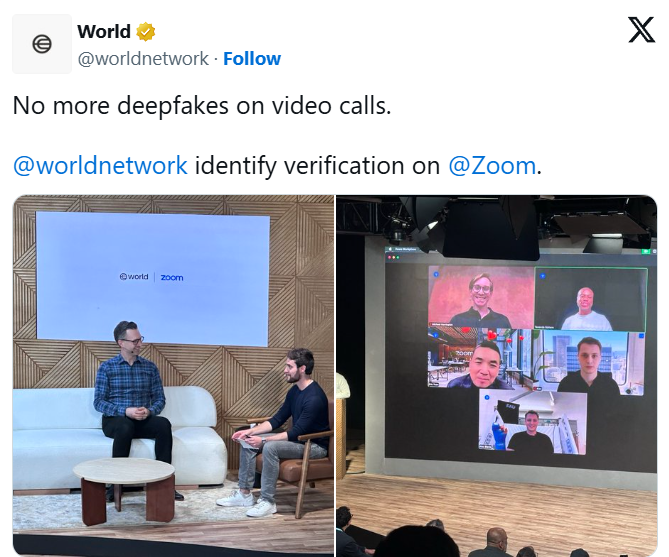
- Технология World’s ID была интегрирована в платформы Zoom и Docusing.
За последние сутки курс токена Worldcoin упал более чем на 10% и теперь, по данным CoinMarketCap, торгуется по $0,2842.
Падение началось после того, как команда проекта интегрировала свою технологию сканирования радужной оболочки в сервис видеоконференций Zoom и платформу для электронной подписи Docusign. Первая использует технологию Deep Face от World для защиты от дипфейков, вторая использует её для верификации World’s ID в цифровых соглашениях. Приложение для знакомств Tinder также расширяет свою систему верификации World ID для пользователей из США.
Поскольку агенты с искусственным интеллектом всё чаще действуют от имени реальных людей, критически важной становится инфраструктура, подтверждающая, что за каждым агентом стоит человек, — заявили в World.
Технология World’s ID основана на устройстве Orb, которое сканирует радужную оболочку глаза пользователя для создания уникальной цифровой идентификационной метки, которая нужна для подтверждения личности без раскрытия персональных данных.
Несмотря на то, что биометрическая верификация преподносится как решение проблемы, критики предупреждают, что масштабный сбор данных повышает риски для конфиденциальности, особенно если сбор контролируется одной компанией. Потенциально это может привести к чрезмерному контролю, особенно если его использовать не по назначению. Ранее редакция Happy Coin News писала, что китайские власти обвинили проект Worldcoin в угрозе национальной безопасности.
Предупреждение о рисках:
Информация на сайте носит исключительно информационный и образовательный характер и не является инвестиционной рекомендацией или финансовым советом. Криптовалюты и цифровые активы связаны с высоким уровнем риска, включая возможную потерю капитала. Редакция не несёт ответственности за решения, принятые на основе опубликованных материалов. Перед принятием инвестиционных решений рекомендуется проводить собственное исследование (DYOR). Ознакомиться с редакционной политикой https://happycoin.club/about/